reslr: quick start guide
Maeve Upton, Andrew Parnell and Niamh Cahill
2026-05-14
Source:vignettes/quick_start.Rmd
quick_start.RmdStep 1: install reslr
Use:
#install.packages("reslr")
#devtools::install_github("maeveupton/reslr")
install_github("maeveupton/reslr")
then,
Note: The JAGS software is a requirement for this instruction sheet and refer back to main vignettes for more information.
Step 2: load in the data into reslr
There is a large example dataset included in the reslr
package called NAACproxydata. In this example, we
demonstrate how to include proxy record data which is stored in a csv
file. This csv file of data can be found in the package and the
readr function reads the csv file:
path_to_data <- system.file("extdata", "one_data_site_ex.csv", package = "reslr")
example_one_datasite <- read.csv(path_to_data)
Using the reslr_load function to read in the data into
the reslr package:
example_one_site_input <- reslr_load(
  data = example_one_datasite)
Step 3: plot the data
plot(
  x = example_one_site_input,
  title = "Plot of the raw data",
  xlab = "Year (CE)",
  ylab = "Relative Sea Level (m)",
  plot_tide_gauges = FALSE,
  plot_caption = TRUE
)
Step 4: Run your statistical model and check convergence
Select your modelling technique from the modelling options available:
| Statistical Model | Model Information |
model_type code |
|---|---|---|
| Errors in variables simple linear regression | A straight line of best fit taking account of any age and measurement errors in the RSL values using the method of Cahill et al (2015). Use for single proxy site. | “eiv_slr_t” |
| Errors in variables change point model | An extension of the linear regression modelling process. It uses piece-wise linear sections and estimates where/when trend changes occur in the data (Cahill et al. 2015). | “eiv_cp_t” |
| Errors in variables integrated Gaussian Process | A non linear fit that utilities a Gaussian process prior on the rate of sea-level change that is then integrated (Cahill et al. 2015). | “eiv_igp_t” |
| Noisy Input spline in time | A non-linear fit using regression splines using the method of Upton et al (2023). | “ni_spline_t” |
| Noisy Input spline in space and time | A non-linear fit for a set of sites across a region using the method of Upton et al (2023). | “ni_spline_st” |
| Noisy Input Generalised Additive model for the decomposition of the RSL signal | A non-linear fit for a set of sites across a region and provides a decomposition of the signal into regional, local-linear (commonly GIA) and local non-linear components. Again this full model is as described in Upton et al (2023). | “ni_gam_decomp” |
For this example, it is a single site and we are interested in how it varies over time select the Noisy Input spline in time. If it was multiple sites, we recommend using a spatial temporal model, i.e. Noisy Input spline in space and time, or for decomposing the signal, i.e. Noisy Input Generalised Additive model.
Once the model is chosen use the reslr_mcmc function to
run it:
res_one_site_example <- reslr_mcmc(
  input_data = example_one_site_input,
  model_type = "ni_spline_t",
  CI = 0.95
)
The convergence of the algorithm is examined and he parameter estimates from the model can be investigated using the following:
summary(res_one_site_example)
#> No convergence issues detected.
#> # A tibble: 2 × 7
#>   variable      mean      sd     mad       q5    q95  rhat
#>   <chr>        <dbl>   <dbl>   <dbl>    <dbl>  <dbl> <dbl>
#> 1 sigma_beta 2.10    0.701   0.541   1.30     3.34    1.00
#> 2 sigma_y    0.00635 0.00482 0.00458 0.000558 0.0153  1.00
Step 5: Plot the results
The model fit results can be visualised using the following function:
plot(res_one_site_example,
xlab = "Year (CE)",
ylab = "Relative Sea Level (m)",
plot_type = "model_fit_plot"
) For the rate of change plot use:
plot(res_one_site_example,
  plot_type = "rate_plot"
)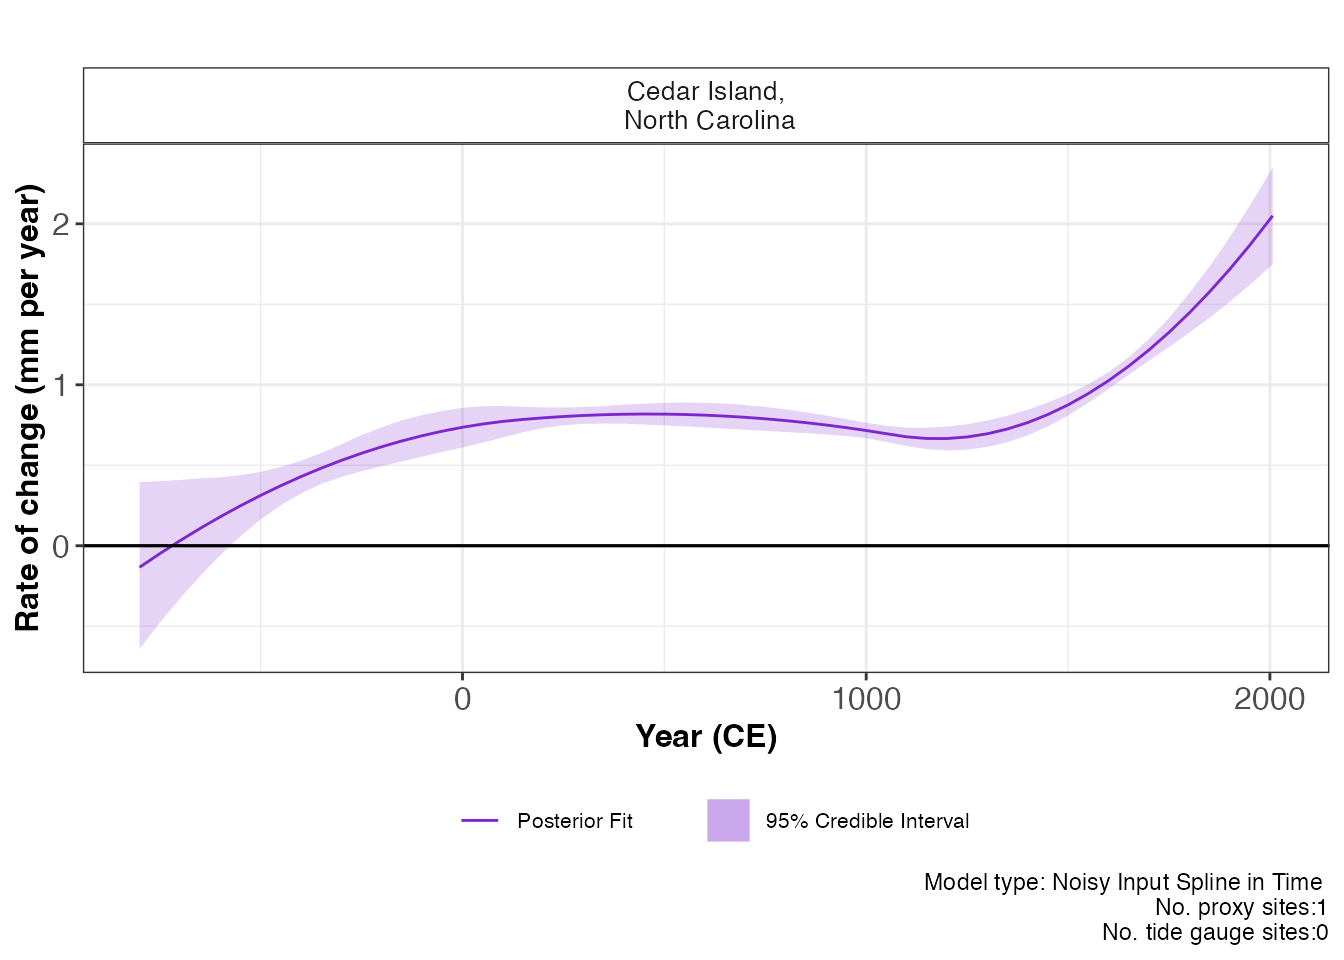
To examine the data creating these plots the user types the following:
output_dataframes <- res_one_site_example$output_dataframes
head(output_dataframes)
#>   Longitude Latitude                       SiteName data_type_id  Age      pred
#> 1    -76.38   34.971 Cedar Island,\n North Carolina  ProxyRecord -800 -2.312863
#> 2    -76.38   34.971 Cedar Island,\n North Carolina  ProxyRecord -750 -2.317262
#> 3    -76.38   34.971 Cedar Island,\n North Carolina  ProxyRecord -700 -2.317575
#> 4    -76.38   34.971 Cedar Island,\n North Carolina  ProxyRecord -650 -2.314001
#> 5    -76.38   34.971 Cedar Island,\n North Carolina  ProxyRecord -600 -2.306737
#> 6    -76.38   34.971 Cedar Island,\n North Carolina  ProxyRecord -550 -2.295980
#>         upr       lwr   rate_pred    rate_upr  rate_lwr  CI
#> 1 -2.398862 -2.230549 -0.13014605 -0.63349054 0.3839745 95%
#> 2 -2.385671 -2.250461 -0.04646370 -0.47410046 0.3907474 95%
#> 3 -2.375158 -2.261223  0.03326625 -0.32560333 0.4033322 95%
#> 4 -2.365202 -2.263850  0.10904360 -0.18714370 0.4150086 95%
#> 5 -2.355284 -2.258463  0.18086836 -0.05641174 0.4237932 95%
#> 6 -2.344328 -2.248204  0.24874051  0.06076019 0.4407374 95%
To examine the additional options in the reslr package,
see the main vignette.